Fuel economy describes the relationship between how much fuel is consumed and the distance traveled. It’s usually expressed in the number of litres per 100km, or the number of kilometres per litre, with the former being the most common. In America and the UK you’ll see it listed as mpg or miles per gallon.
To calculate fuel economy for vehicles delivered in Australia manufacturers usually quote a combination of driving based on the European Driving Cycle. It’s often done on a roller test bench so that environmental variations can be eliminated, but there are professional drivers who are specialists in conducting fuel economy tests. The test is on a flat road at around 25 degrees Celcius.. The measurements given to the public are:
- First 780 seconds of simulated driving in an urban environment (i.e. around town).
- 780 – 1180 seconds of simulated driving in an extra-urban environment (i.e. a highway)
- The total of the test is called the combined cycle or complete cycle.
- CO2 emissions are calculated on the complete cycle, too.
Urban cycle
The urban cycle is:
- Start the engine and wait 6 seconds in neutral
- Change into first gear and wait 5 seconds before moving off
- Accelerate to 15kph in 4 seconds
- Hold 15kph for 8 seconds
- Brake to zero in 5 seconds
- Stop for 21 seconds
- At 49 seconds accelerate to 32kph in 12 seconds
- Cruise at 32kph for 24s
- Brake to a full stop in 11s
- Pause for 21s
- At 117s accelerate to 50kph in 26 seconds
- Cruise at 50kph for 12s
- Decelerate to 35kph in 8s
- Cruise at 35kph for 13s
- Brake to a full stop in 12s
- Pause for 7s
This is now 195s and a theoretical distance of 1017m. The cycle is repeated another three times giving a total theoretical distance of 4067m over 780s with an average speed of 18.77kph.
Specific times are given to change gear if it’s a manual car.
As you can see, this procedure might not be typical for many people. Taking 26 seconds to accelerate to 50kph is ludicrous as most cars will do this in less than 6 seconds, and comfortably in under 10 seconds.
Extra-urban cycle
The extra urban cycle is designed to simulate slightly more aggressive driving at higher speed. The maximum speed is limited to 120kph.
- Idle for 20s
- Accelerate to 70kph in 41s
- Cruise for 50s
- Decelerate to 50kph in 8s
- Cruise for 69s at 50kph
- Accelerate back to 70kph in 13s
- Cruise at 70kph for 50s
- Accelerate to 100kph in 35s
- Cruise for 30s
- Accelerate to 120kph in 20s
- Cruise for 10s
- Brake to a stop in 34s
- Idle for a final 20s.
Total duration is 400s and the theoretical distance is 6956m with an average speed of 62.6kph.
Again, this does not represent the majority of driving.
Example vehicles
Let’s take two completely different vehicles as examples, both of which I have driven and tested in every day motoring situations over the course of a week:

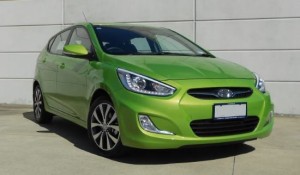
Hyundai Accent 1.6 petrol Elite sedan: Hyundai’s website gives the figures as:
- Urban: 9.2 litres per 100km (l/100km)
- Extra urban: 5.1l/100km
- Combined: 6.6l/100km
- My combined figure: 6.9l/100km
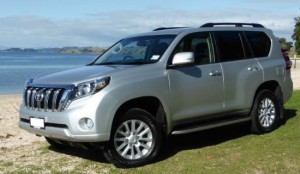
 In comparison let’s look at something a bit bigger and more expensive: the Toyota Land Cruiser Prado V6 4-litre petrol. Toyota’s website gives the figures as
- Urban: 15.4l/100km
- Extra urban: 9.3l/100km
- Combined: 11.5l/100km
- My combined figure: 14.8l/100km
With the Accent, my driving approximated the combined fuel economy – that’s with a week’s worth of around town and motorway driving. With the Prado, it might have been that I did more motoring around town, or it might have been that the economy that Toyota suggests is simply unrealistic in the real world.
Therefore, you should not trust fuel economy figures given to you by manufacturers. I have tested and written about something like 400 cars and very few will stack up to their claimed figures under regular driving. While all vehicles tested should adhere to the testing regulations, chances are that the tests won’t approximate your driving. Budget for the fuel economy to be at least 2l/100km worse than what is quoted. This could be more as the vehicle gets older.
There has been a recent call for a more realistic testing regime that approximates the real world performance of cars, but this would throw some manufacturers into significant trouble in Europe because they fine-tune their cars to achieve 99g/km of CO2 or less, which puts them in a favourable tax bracket. A more realistic driving test would undoubtedly move them above 100g/km of CO2. There is a new test called the Wordwide harmonized Light vehicle Test Procedures (WLTP) in planning and due to by implemented for passenger vehicles from October 2015.

[…] in a standard form for urban, extra urban and combined cycle driving which is determined by a standardised test, described here. While this test doesn’t resemble everyday driving, and therefore tends to be more economical […]